


Turn Trial Results Into Real Risks: 4 Checks for Patients & Caregivers
September 7, 2026
Turn Trial Results Into Real Risks: 4 Checks for Patients & Caregivers

Before you trust any headline about a new treatment, check four things: does the trial population look like you or your loved one, was the outcome something patients actually feel (survival, symptoms) rather than a lab number, what is the absolute benefit and harm rather than just the relative percentage, and did the results hold up once you account for dropouts and shaky statistics. The rest of this guide walks through exactly where to find each answer in a published trial, how to read the tables and survival curves, and what to ask your care team once you have real numbers in hand.
TL;DR:
- The participant flow diagram reveals how many people were screened, enrolled, and completed the trial, which affects how applicable the results are to broader populations.
- Baseline characteristics should be compared to your own situation, especially age and disease stage, to determine if the trial findings are transferable.
- Absolute risk reduction and number needed to treat provide a clearer picture of actual benefit than relative risk figures, which can be misleading.
- Kaplan–Meier curves reveal the timing and durability of benefits, with caution needed if curves cross or the numbers at risk are very low at later time points.
- Check for signs of bias or fragility, such as high dropout rates or unreported outcomes, to assess the reliability of the trial’s findings before acting on them.
Table of Contents
- How to Understand Clinical Trial Results in the Tables and Figures
- Making Sense of RR, ARR, NNT, and Confidence Intervals
- Reading Survival Curves and Time-to-Event Data Correctly
- Spotting Bias, Fragile Results, and Selective Reporting
- Turning Trial Results Into a Real Decision
- Where to Go Next: HCRF Resources for Interpreting Trial Results
- Why HCRF Puts Patient Education Alongside Research Funding
- Sources
How to Understand Clinical Trial Results in the Tables and Figures
Every trial report buries its most honest information in the tables most readers skip. That is where the real story lives, not in the abstract’s opening sentence.
Start with the participant flow diagram, often called a CONSORT figure. It shows how many people were screened, how many enrolled, and how many actually finished the study in each arm. A trial that screened many people to enroll a much smaller number is telling you something about how selective its population is. This matters because a treatment tested only in a narrow, healthy subset of patients does not automatically work the same way in someone older, sicker, or managing multiple conditions. Researchers call this the question of transportability, or external validity, and it deserves as much attention as whether the drug worked at all.
Next, read the baseline characteristics table, usually Table 1. It lists age, sex, disease stage, prior treatments, and other traits for each study arm. Compare those numbers to your own situation or your loved one’s. If the trial enrolled mostly people under 65 with early-stage disease, and you are 78 with more advanced illness, the results may not transfer cleanly.
A few habits will save you from misreading the data:
- Check the denominators in every results table. A benefit reported as “40% improvement” means little without knowing whether that came from 4 out of 10 patients or 400 out of 1,000.
- Look at the inclusion and exclusion criteria near the methods section. These lists tell you exactly who was kept out of the trial, which is often as informative as who got in.
- Scan the adverse-event table for imbalances between arms. If the treatment arm shows notably more serious events than placebo, that harm has to be weighed against the benefit, not treated as a footnote.
- Note the follow-up duration. A drug that looks safe after six months might carry different risks after two years.
Researchers who study how clinicians read papers found that comparing dropout rates between study arms is one of the fastest ways to catch early trouble. If far more people quit the treatment arm than the control arm, ask why. Side effects, inconvenience, or lack of benefit are all plausible explanations, and the paper should address which one it was.
Making Sense of RR, ARR, NNT, and Confidence Intervals
This is where most trial coverage goes wrong, and it is usually not by accident. Relative risk reduction sounds far more impressive than absolute risk reduction, so it gets the headline.
Here is the distinction in plain terms:
- Relative risk (RR) compares the event rate in the treatment group to the event rate in the control group. An RR of 0.5 means the treatment group had half the risk of the control group.
- Relative risk reduction (RRR) is just 1 minus the RR, expressed as a percentage. An RR of 0.5 becomes a 50% RRR, which sounds dramatic.
- Absolute risk reduction (ARR) is the actual difference between event rates in the two groups, measured in real people, not percentages of percentages.
- Number needed to treat (NNT) is 1 divided by the ARR. It tells you how many patients need to receive the treatment for one additional person to benefit.
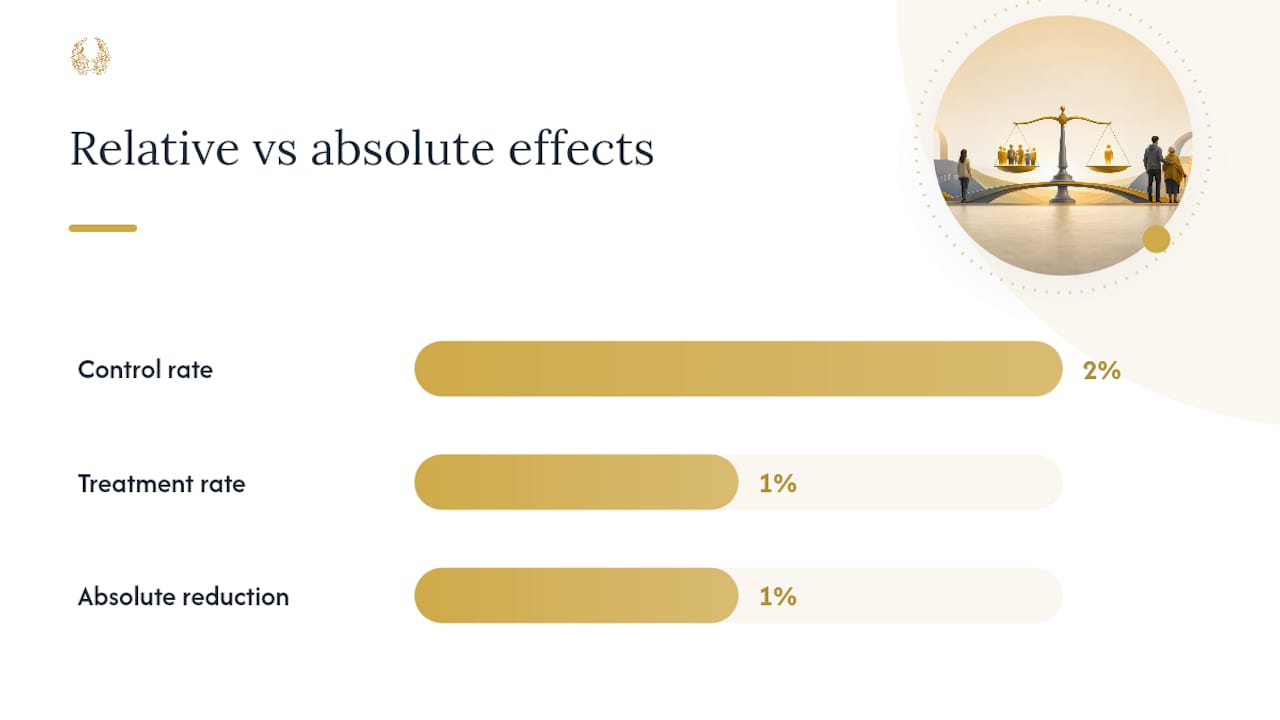
Statistic Callout: A trial reporting a “50% reduction in risk” might mean the event rate dropped from 2% to 1%. That is a 50% relative reduction but only a 1 percentage point absolute reduction, an ARR of 0.01, which works out to an NNT of 100. You would need to treat 100 people to prevent one event.
Both numbers are technically true. Only one tells you what to expect if you are the patient. Clinical researchers have specifically recommended favoring absolute measures over relative ones precisely because relative risk can make a marginal benefit look transformative.
Confidence intervals add another layer worth understanding. A 95% confidence interval around an effect estimate gives you a range where the true effect probably falls. A narrow interval, say an ARR of 5% with a confidence interval of 3% to 7%, tells you the estimate is fairly precise. A wide interval, like an ARR of 5% with a confidence interval of negative 1% to 11%, tells you the study cannot rule out that the treatment does almost nothing, or even slightly more, or slightly less. When a confidence interval crosses zero (for a difference) or one (for a ratio), the result usually is not statistically significant, regardless of how the p-value is framed elsewhere in the abstract.
Try this with any trial report you read next: find the raw event count in each arm before you look at the RRR the authors chose to highlight. Calculating your own ARR and NNT from those raw numbers takes about thirty seconds and often changes how impressive a result looks.
Reading Survival Curves and Time-to-Event Data Correctly
Median survival is the number reporters love and the number most likely to mislead you when read alone. It only tells you the point at which half the patients in a group had the event, whether that is death, disease progression, or another endpoint. It says nothing about what happened to the other half.
Kaplan–Meier curves show the fuller picture. Each curve plots the proportion of patients still event-free over time. What matters is not just where the lines end but how they behave along the way:
- Look at when the curves separate. Early separation followed by parallel lines suggests an early, front-loaded benefit. Late separation suggests the benefit takes time to appear.
- Check the tail of the curve, the far right side. A curve that flattens out and holds steady at a higher level than the comparison arm can indicate durable, long-term benefit that the median alone would miss entirely.
- Always find the numbers-at-risk table printed beneath the plot. If only a handful of patients remain in each arm at the later time points, treat that part of the curve with real caution, since a couple of events can swing the line dramatically.
Curves that cross each other are a particular warning sign. When two Kaplan–Meier lines cross partway through follow-up, it usually means the treatment effect is not consistent over time, and a single hazard ratio summarizing the whole curve may obscure more than it reveals.
Pro Tip: Before trusting a median survival figure, scroll down to the numbers-at-risk row under the graph. If it drops below 20 or 30 patients per arm at the point where you are reading the curve, the estimate there is far shakier than the smooth line makes it look.
Spotting Bias, Fragile Results, and Selective Reporting
Not every well-designed trial produces a result you should act on immediately. Some hold up under scrutiny. Others fall apart the moment you look closely at how the study was run or how the data were reported.
Start with the basics of trial design. Was randomization done properly, and was allocation concealed so investigators could not predict which group a new patient would join? Was the trial blinded, and if not, could that have influenced how outcomes were measured or reported? Were the outcomes specified in advance, or does the paper’s primary endpoint look suspiciously like whatever came out positive?
A few checks separate a durable finding from a fragile one:
- Ask about the fragility index, a measure of how many patients would need to switch from a non-event to an event before the statistical significance disappears. A low fragility index means the result is one or two patients away from a different conclusion.
- Compare loss to follow-up between arms, and see whether the analysis used intention-to-treat (everyone as randomized) or per-protocol (only those who completed treatment as assigned). Intention-to-treat is the more conservative, generally more trustworthy standard.
- Watch for surrogate outcomes, like tumor shrinkage or a lab marker, standing in for outcomes that actually matter to patients, like survival or quality of life. A surrogate can improve without any real difference in how long or how well someone lives.
- If the primary result is a composite outcome combining several events into one number, dig into which component actually drove the effect. A composite outcome that improves purely on a minor component while leaving mortality unchanged is a very different result than one where survival itself improved.
If a published paper feels thin on detail, the trial’s full record on Clinicaltrials usually includes the pre-specified outcomes, participant flow, and results tables that the journal article condensed or left out entirely.
Turning Trial Results Into a Real Decision
Interpretation only matters if it leads somewhere. Once you have pulled apart a trial’s population, its absolute effect size, and its robustness, use this sequence to decide what it means for you or the person you are caring for.
- Match the population. Compare age, disease stage, prior treatments, and health status in the trial to your own situation. If you fall outside the enrolled population, the benefit may be smaller or the harms larger than reported. This is sometimes called indication creep, when a treatment proven in a narrow, often higher-risk group gets used more broadly, quietly raising the number needed to treat.
- Weigh absolute benefit against absolute harm. Put the ARR for benefit next to the ARR for serious side effects. A treatment with a small benefit and a similarly small risk of serious harm is a very different proposition than one with a small benefit and a large risk.
- Check whether the effect clears a meaningful threshold. Ask whether the improvement is large enough to matter in daily life, not just large enough to reach statistical significance. This threshold is sometimes called the minimal clinically important difference.
- Assess robustness. Revisit dropout rates, the fragility index, and whether the primary outcome was pre-specified before deciding how much weight to give the result.
- Discuss alternatives and monitoring. No single trial exists in a vacuum. Ask what else is available and how you would be monitored on this treatment.
Bring these specific questions to your clinician:
- “Based on people like me, what is the realistic chance this will help, and how much?”
- “What are the likely side effects, how common are they, and how long do they last?”
- “How will we know if it’s working, and what does monitoring look like?”
- “Is there a systematic review or a second trial that confirms this result?”
Pro Tip: Ask your clinician directly for the NNT, not just the percentage improvement. Most physicians can pull it up quickly, and it reframes the conversation around real numbers instead of percentages.
A single trial, however well designed, is one data point. A systematic review or a replication study that confirms the finding across different populations carries more weight than any one paper, no matter how large.
Where to Go Next: HCRF Resources for Interpreting Trial Results
Understanding a paper is one step. Knowing what a trial actually involves, and whether one might fit your situation, is another. The Hippocratic Cancer Research Foundation maintain a set of plain-language resources built specifically for that gap.
If you are trying to figure out whether a treatment’s evidence came from an early-stage or late-stage study, Guides to clinical trial phases break down what each phase can and cannot tell you. Explanations of informed consent requirements cover what documentation to expect before signing anything.
Cost and eligibility questions come up almost immediately once a result looks promising. Resources on what qualifies you to enroll and what trial participation costs by phase walk through both in plain terms.
- Verify any trial’s registration status and full result set directly on ClinicalTrials.gov before making a decision based on a journal summary alone.
- Use phase and eligibility guides to see whether a specific trial’s population resembles your own.
- Reach out to educational teams if you need help working through a specific paper or trial listing.
Why HCRF Puts Patient Education Alongside Research Funding
We fund research because new treatments have to come from somewhere. We publish guides like this one because a new treatment does nothing for a patient who cannot make sense of the paper describing it. Our clinical trial eligibility resource exists for exactly that reason, to turn dense trial criteria into something a patient or caregiver can actually use at a kitchen table, not just in a clinic. If you want guidance on a specific trial or result, or you want to support the research that makes these results possible in the first place, visit Hippocratic Cancer Research Foundation to learn more or get in touch.
— HCRF
This article is general information, not a substitute for advice from a qualified doctor. Consult a qualified healthcare professional about your own circumstances before acting on anything here.
Recommended

Discover how workplace giving programs can support cancer research. Easily donate or request employer matches to make an impact today!
Read More →