


Donors: 5 Steps to Verify Charity Overhead Percentage Like HCRF
September 22, 2026
Donors: 5 Steps to Verify Charity Overhead Percentage Like HCRF

A charity overhead percentage measures the share of spending that goes to management and fundraising rather than direct programs, and it should never be your primary reason to give or withhold a gift. Leading evaluators including Candid treat it as one data point among many, not a scorecard. Before you decide, pull the charity’s Form 990 and cross-check it against Candid, CharityWatch, or the BBB Wise Giving Alliance.
TL;DR:
- Most charities’ overhead ratios are highly influenced by accounting methods, joint-cost allocations, and in-kind donations, which can distort true efficiency.
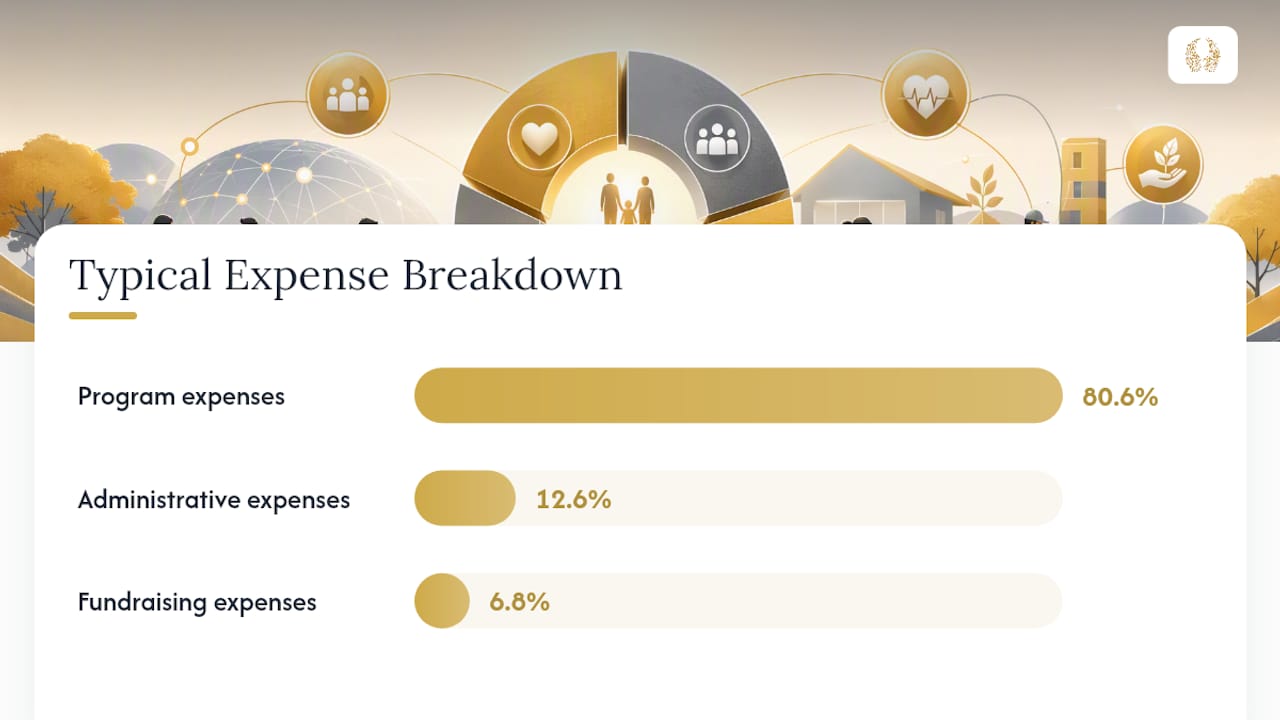
- Sector data shows a typical program expense ratio near 80.6%, with administrative costs around 12.6%, but large or new charities may differ significantly from these medians.
- Fixed overhead rules like 80/20 or 33% are not actual standards and can be misleading; what matters more are contextual factors and overall impact.
- Donors should verify financials through Form 990 and look for multiple years of data, rather than rely on single-year ratios or assumptions based on sector heuristics.
- Focusing on actual program outcomes and transparency provides a better measure of a charity’s effectiveness than obsessing over a single overhead percentage.
Table of Contents
- What the Charity Overhead Percentage Actually Measures
- What Counts as a Good Program or Overhead Percentage?
- Why Overhead Percentage Can Be Misleading
- How to Read an Overhead Percentage Like a Careful Donor
- Where to Verify the Numbers Yourself
- How HCRF Balances Program Spending and Infrastructure
- A Better Question Than “What’s the Overhead?”
- Support Cancer Research at HCRF
- Sources
- FAQ
What the Charity Overhead Percentage Actually Measures
Every charity that files with the IRS has to sort its spending into three buckets on Form 990: program services, management and general, and fundraising. The overhead percentage is simply the combined share of management and fundraising costs against total expenses. Program percentage is the mirror image: the portion spent directly on the mission.
That sounds tidy on paper. In practice, the lines get blurry fast, and the blurriness is exactly where donors get misled.
Consider joint costs. A charity mails a newsletter that both educates readers about its cause and asks for donations. Accounting standards allow that mailing to be split between “program” and “fundraising” based on estimated intent and content, which means two organizations doing nearly identical mailings can report very different overhead numbers depending on how aggressively they allocate costs to programs.
In-kind donations create similar distortions. A charity that receives free office space or donated advertising records the fair value of that gift as both revenue and an expense, often in program or overhead categories that inflate or deflate ratios without any real change in how efficiently the group operates.
Staff time allocation is the biggest lever of all. A single employee who spends part of the week running a soup kitchen and part of the week writing grant reports gets split across categories based on timesheets or estimates, and small differences in how that split gets logged can move an organization’s ratio by several points. CharityWatch notes that these classification differences are precisely why raw ratios need adjustment before comparison.
What typically counts as “program” versus “overhead” comes down to a few recurring categories:
- Program services: direct services, research grants, educational materials, patient support, and the staff time spent delivering them.
- Management and general: executive salaries tied to organizational oversight, board governance, accounting, legal compliance, and human resources.
- Fundraising: event costs, donor solicitation mailings, grant writing tied to revenue generation, and development staff salaries.
- Joint-cost activities: hybrid materials or campaigns that combine education and solicitation, allocated by estimated purpose.
None of this means the numbers are meaningless. It means a single percentage, stripped of context, tells you less than you think.
What Counts as a Good Program or Overhead Percentage?
Sector-wide data gives donors a far more useful anchor than any fixed rule. A large-sample analysis of U.S. Form 990 filings covering nearly 70,000 organizations found a median program expense ratio near 80.6%, with administrative costs sitting at a median of roughly 12.6%. That leaves fundraising costs making up most of the remainder for a typical organization.
Those medians shift with size and sector. A small regional food pantry with two staff members will often show a different cost structure than a national research foundation running clinical trial support programs, simply because larger organizations can spread fixed administrative costs across bigger budgets. Newer organizations also tend to run higher overhead temporarily while they build donor pipelines and internal systems, which is normal growth, not mismanagement.
Pro Tip: A charity in its first three years of operation often carries higher fundraising costs as it builds a donor base. Judge a young organization’s trajectory over several years of filings, not a single year’s snapshot.
| Metric | Typical sector median | Common misconception |
|---|---|---|
| Program expense ratio | ~80.6% | “Should generally exceed 80%” |
| Administrative expense ratio | ~12.6% | “Anything above 10% is wasteful” |
| Fixed rules donors cite | None hold up universally | 80/20, 30-70, or 33% rules treated as law |
That table exposes the problem with popular shortcuts. The “80/20 rule,” the “30-70 rule,” and the “33% rule” all get repeated as if they were regulatory standards. They are not. No federal law sets a maximum overhead percentage for charities, and sector medians show real organizations landing above and below these round numbers constantly depending on mission type, geography, and growth stage. A medical research foundation funding lab equipment and clinical trial infrastructure will carry different cost patterns than a direct-service pantry handing out groceries, and neither pattern is inherently more virtuous.
Treat these percentages as a range to expect, not a passing grade to hit.
Why Overhead Percentage Can Be Misleading
The obsession with rock-bottom overhead has a name in the sector: the Overhead Myth. A coalition of the country’s most prominent evaluators, including Candid, spelled it out plainly in a joint letter, “To the Donors of America,” arguing that overhead ratios alone say almost nothing about whether a charity actually accomplishes its mission.
The size of a charity’s administrative or fundraising percentage, taken alone, tells you nothing about whether that charity delivers results. Focusing on overhead ratios above all else pushes organizations to underinvest in the very systems that make programs work.
Nonprofit Quarterly’s analysis calls the downstream effect the “nonprofit starvation cycle.” Donors demand low overhead, so charities cut training, evaluation, and infrastructure spending to meet an arbitrary number. Programs then run on threadbare systems, understaffed finance teams, and outdated technology. Ironically, the organizations rewarded for the lowest reported overhead are sometimes the ones least equipped to scale or measure their own impact.
This isn’t a fringe critique. Bridgespan’s research on the topic shows how the pressure cascades:
- Nonprofits underinvest in staff training and retention to protect their reported ratio.
- Technology and data systems go unfunded, weakening the organization’s ability to track and report outcomes.
- Fundraising staff get cut precisely when donor cultivation and stewardship need investment, shrinking future revenue.
- Evaluation and quality improvement work, which sits in “overhead,” gets skipped entirely.
None of this correlates with better outcomes. A low ratio can just as easily signal deferred maintenance and burned-out staff as it can signal discipline.
The honest takeaway: overhead percentage measures spending allocation, not effectiveness. Those are related concepts, but they are not the same thing, and mistaking one for the other is the single most common error donors make when screening charities.
How to Read an Overhead Percentage Like a Careful Donor
You don’t need an accounting degree to interpret these numbers responsibly. You need a short routine, applied consistently every time you consider a gift.
- Pull the Form 990. Every charity filing above the smallest revenue threshold must submit one, and it’s public record. Confirm the reported program, management, and fundraising figures match what the charity states on its own website.
- Check for multiple years, not one snapshot. A single bad year can reflect a one-time capital investment, a lawsuit, or a leadership transition rather than chronic mismanagement.
- Request recent audited financial statements. Larger charities often have independent audits that go deeper than the 990’s summary figures.
- Ask what the charity measures as an outcome. A program report should describe results, not just activity counts. “We served 400 families” is an activity. “82% of enrolled families maintained stable housing after 12 months” is an outcome.
- Look at unrestricted funding and reserves. A charity with healthy unrestricted reserves has flexibility to weather downturns and invest in infrastructure without constant emergency appeals.
When you contact a charity directly, a few questions separate a strong answer from a weak one. Ask how the organization measures program success beyond activity counts, and listen for specific metrics rather than vague mission language. Ask how leadership decided on its current staffing and technology investments, and expect a reasoned answer tied to strategy rather than a defensive one about optics. Ask what percentage of revenue comes from unrestricted gifts, since heavy reliance on restricted, program-only funding often starves the very infrastructure that keeps a charity running well.
Watch for red flags that go beyond a simple number. An organization that refuses to share its Form 990 or claims it “doesn’t have one” should raise immediate concern, since the filing is public and searchable. An overhead ratio near zero for several consecutive years often means underreporting rather than efficiency; genuine organizations have real administrative costs. Wild swings in reported ratios from year to year without explanation suggest either accounting inconsistency or deliberate manipulation ahead of a fundraising push, and both deserve a direct question to staff before you give.
Our guide to evaluating a charity before you give walks through how to weigh these signals together rather than fixating on any single ratio.
Where to Verify the Numbers Yourself
The Form 990 lives on a charity’s own site, on ProPublica’s Nonprofit Explorer, or directly through IRS records. Part IX of the form breaks out functional expenses line by line, and the accompanying schedules explain how joint costs and in-kind gifts got allocated. Reading Part IX alongside the charity’s own annual report tells you whether the numbers line up or whether the public messaging oversimplifies what the filing actually shows.
Charity evaluators do useful work interpreting these filings so donors don’t have to start from scratch. CharityWatch adjusts raw program ratios using its own methodology, correcting for joint-cost allocation and unusual one-time expenses before assigning an efficiency grade. Candid and the BBB Wise Giving Alliance take a broader approach, weighing governance, transparency, and reporting quality alongside financial ratios rather than ranking charities on cost percentages alone.
A few habits make evaluator profiles more useful:
- Read the methodology notes, not just the headline grade or star rating; every evaluator adjusts raw numbers differently.
- Cross-reference at least two evaluators before drawing a conclusion, since methodologies and adjustments vary.
- Treat an evaluator’s “needs improvement” flag on transparency as seriously as a flag on financial ratios.
- Check the filing date. A profile built on a 990 from several years back may not reflect a charity’s current operations.
When a charity’s reported numbers seem unusually strong or unusually weak, an audited financial statement or an independent program evaluation carries more weight than the summary ratio alone. Larger, established charities typically publish these on request, and their absence is itself useful information.
How HCRF Balances Program Spending and Infrastructure
The Hippocratic Cancer Research Foundation is a 501©(3) built around a specific and unusual mission: funding “out of the box” cancer research at the Robert H. Lurie Comprehensive Cancer Center of Northwestern University, the kind of high-risk, high-reward science that often gets passed over by traditional grant committees.
Funding that work responsibly means investing in more than direct grants. Donor communications, event logistics, and administrative oversight are not distractions from the mission. They are what keeps a research pipeline funded year over year instead of depending on a single lucky season of giving. A gala or a campaign that costs money to run is also the mechanism that keeps a laboratory staffed and a clinical trial enrolling patients next year.
HCRF believes donors deserve to see that trade-off clearly rather than have it hidden behind a single flattering ratio. Our donation impact reporting resource shows how funded research translates into measurable progress, and our guide on evaluating a charity before you give walks through the same verification steps outlined above. Nonprofit fundraising and communications investment, done well, is what sustains programs long enough to produce results, a point echoed in broader guidance on nonprofit digital engagement strategy.
A Better Question Than “What’s the Overhead?”
Donors ask about overhead percentage because it feels like a quick, objective checkpoint. It is neither as objective nor as useful as it feels. The better question is simpler and harder to dodge: what did this organization actually accomplish with the money it raised last year, and can it show you?
That question forces a charity to talk about outcomes rather than optics. It also rewards organizations willing to publish detailed impact reports, invite scrutiny of their audited financials, and admit when a program didn’t hit its target. A charity confident in its results rarely hides behind a ratio.
A few small habits shift your giving toward better information. Favor unrestricted gifts when you trust an organization, since restricted funding often forces charities into the very underinvestment that the Overhead Myth describes. Ask for a program-level outcome report before your next gift, not just a thank-you letter. Reward transparency itself, since organizations that willingly publish detailed 990 notes and third-party audits are telling you something about their culture that no single ratio can capture.
Sector-wide pushes toward fuller reporting, including the joint evaluator statement on the Overhead Myth, exist precisely because donors have the power to change what charities optimize for. If donors keep rewarding the lowest number instead of the clearest results, charities will keep managing to that number. Change what you ask for, and reporting follows.
— HCRF
Support Cancer Research at HCRF
HCRF exists to fund the cancer research that traditional grant committees pass over, the high-risk, high-reward science happening at the Robert H. Lurie Comprehensive Cancer Center of Northwestern University. Unlike giving to a general fund where dollars disappear into an annual report, HCRF’s events connect your gift directly to research progress you can follow.

Two upcoming events make it easy to get involved directly. Cocktails for a Cure is priced at $150 per person and offers a lower-commitment way to meet the researchers and donors behind HCRF’s work. For a larger evening built around the foundation’s full mission, HCRF’s 13th Annual Wings To Cure Gala brings together longtime supporters and new donors for the foundation’s signature fundraising night. If you’d rather give directly and track how funds are used, visit HCRF’s main site to learn more about current research campaigns and reporting. Reserve your seat at either event today, or make a direct gift to fund the next round of research grants.
Sources
Start with a charity’s own Form 990, the primary public record for program, management, and fundraising expenses. Candid offers deep organizational profiles and the original Overhead Myth research. CharityWatch publishes adjusted efficiency ratings that correct for joint-cost allocation issues. Nonprofit Quarterly provides ongoing sector analysis on why overhead fixation backfires, and the Bridgespan Group has documented the starvation cycle in detail across hundreds of organizations. Cross-checking two or three of these before you give takes less time than most donors assume.
This article is general information, not a substitute for advice from a qualified financial advisor. Consult a qualified financial professional about your own circumstances before acting on anything here.
- Overhead costs and the nonprofit overhead myth (Candid)
- The Overhead Myth | Nonprofit Quarterly
- Our Charity Rating Process (CharityWatch)
FAQ
What Is a Good Overhead Percentage for a Charity?
There’s no single correct number, but sector data shows a median program expense ratio near 80.6%, meaning overhead (admin plus fundraising) typically lands around 19-20% for a broad sample of filers. Smaller or newer organizations often run higher overhead temporarily while building infrastructure, so context matters more than hitting an exact figure.
What Is the 33% Rule for Nonprofits?
Candid and other leading evaluators explicitly reject fixed thresholds like this because they ignore organization size, sector, and growth stage.
What Is the 30-70 Rule for Charities?
The “30-70 rule” claims a charity should spend no more than 30% on overhead and at least 70% on programs, treating that split as a universal pass/fail line. It’s a popular heuristic, not an accounting standard, and real sector medians show most charities cluster closer to an 80/20 program-to-overhead split without any law requiring it.
What Is the 80/20 Rule for Charities?
The 80/20 rule suggests charities should spend roughly 80% on programs and no more than 20% on overhead combined. It roughly tracks the sector’s actual median program ratio of 80.6%, but treating it as a strict cutoff ignores legitimate variation by size, mission type, and organizational age.
Where Can I Check a Charity’s Actual Overhead Numbers?
Pull the charity’s Form 990 directly from the IRS or the organization’s own website, since it lists program, management, and fundraising expenses by law. Cross-reference that filing against a profile on Candid, CharityWatch, or the BBB Wise Giving Alliance, which adjust and contextualize the raw figures rather than reporting them at face value.
Recommended

5 Million Dollar Donation Is Received to The Hippocratic Cancer Research Foundation
Read More →
Explore groundbreaking advancements in innovative cancer research, including new therapies and strategies transforming patient care in oncology.
Read More →